Network Inspector
Radon IDE comes with a Network Inspector panel allowing you to inspect network traffic.
Enabling the Network Inspector
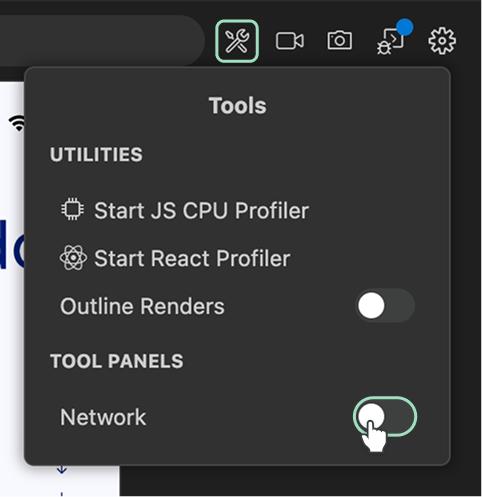
To enable the Network Inspector tab, first click the Tools button located on the top-right corner of the IDE. Then, enable the toggle next to the Network label. A new Network tab will appear in your editor.
If you hide the Network panel, you can reopen it by using the Link icon next to the Network label.
Using the Network Inspector
You can access the Network tab from IDE by clicking the Link icon next to the Network label in the Tools menu.
You can customize the Network Inspector behaviour using the following buttons:
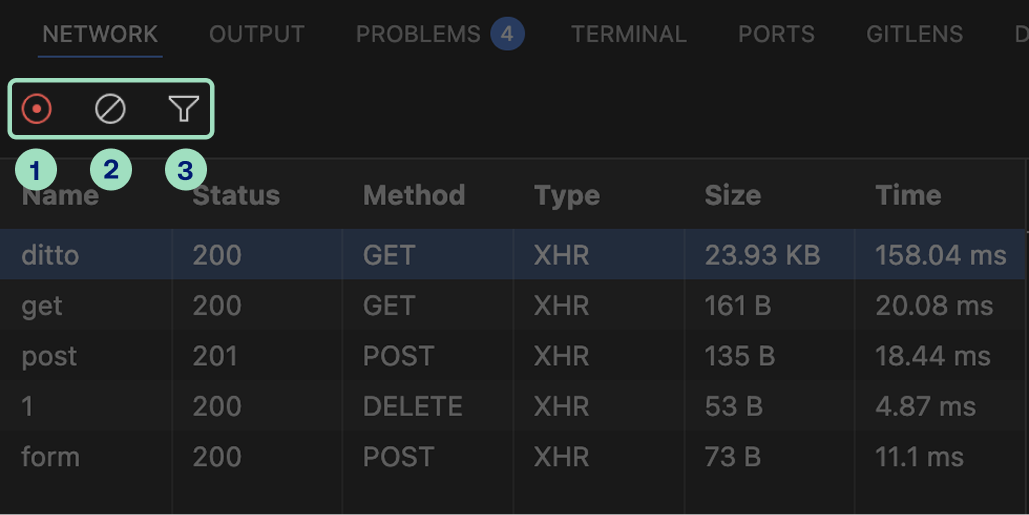
- Toggle network activity recording - starts or stops the capture of network requests made by your application.
- Clear network log - erases all currently displayed network requests displayed in a list.
- Filter domains - opens input field allowing for filtering the displayed logs.
Filtering and sorting
Clicking on the Filter button opens an input field where you can define filters for the logs displayed. Alongside the field, an Invert toggle allows to reverse the filter criteria.

- Apply filters globally across all columns by entering plain-text.
- Apply filters to specified columns using the syntax
column:valuefor simple filters, orcolumn:"value with spaces"for values that include spaces.
Hovering over a column header also displays a filter icon. Clicking it inserts a filter template directly into the filter input field for you.
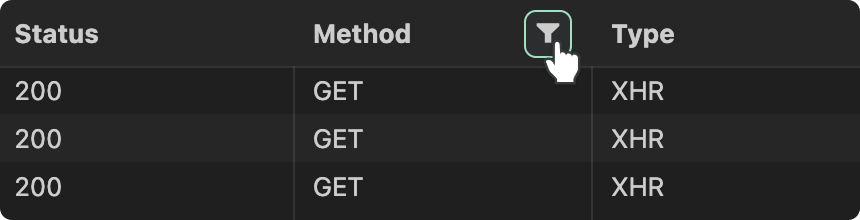
Clicking directly on a column header will additionally Sort the logs according to the values in that column.
Exploring network request details
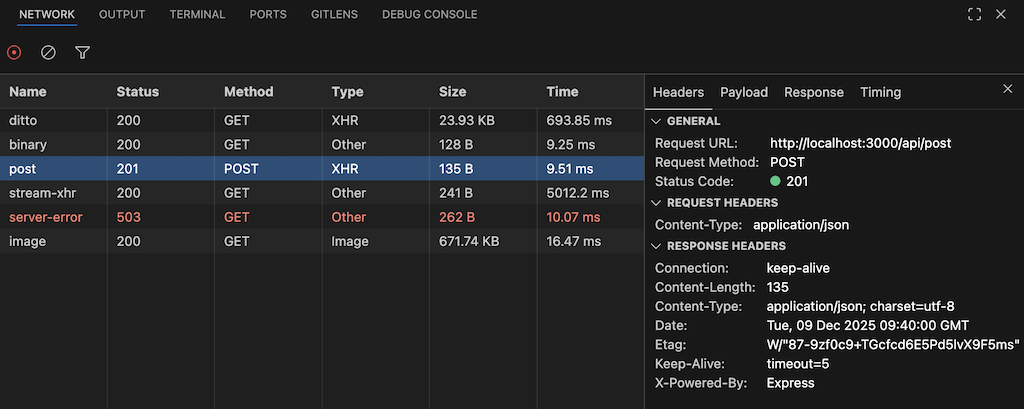
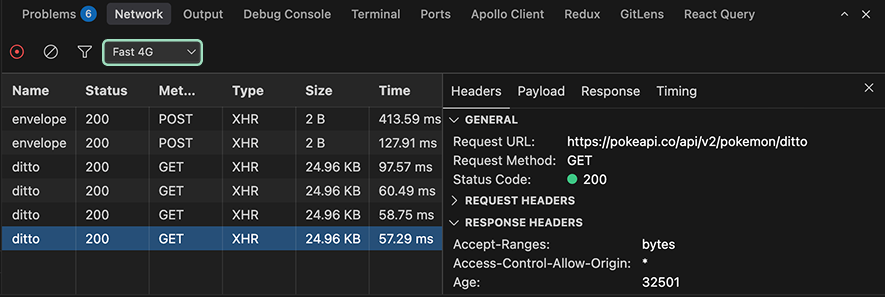
The Network Inspector displays a log of all network requests made by your application in a table. Each row represents a single request, and the columns provide key information about that request namely:
- Name - segment of the path of the URL request.
- Status - HTTP status code returned by the server.
- Method - HTTP request method used (e.g. GET, POST, PUT, DELETE, etc.).
- Type - resource type of the received response.
- Size - total size of the transferred resource.
- Time - total duration of the request.
Clicking on the network log shows more details about the contents of the request. The details of the request are grouped into into Headers, Payload, Response, and Timing tabs.
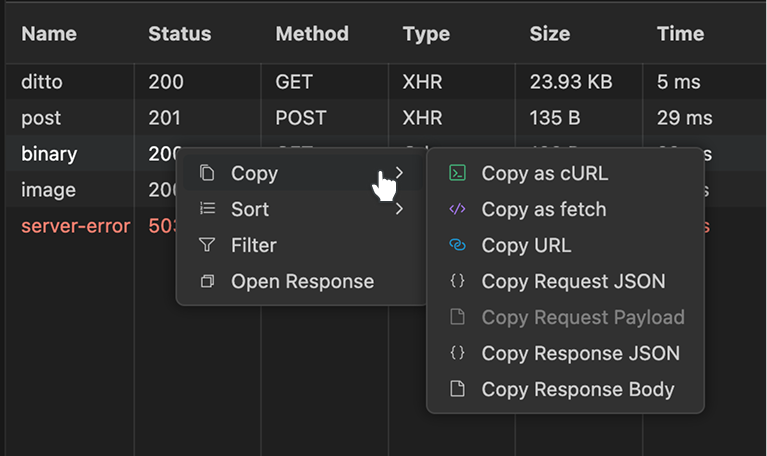
Right clicking on the network log opens Context Menu, allowing for sorting and filtering the logs, copying the request details, refetching and opening responses in the editor's tab.
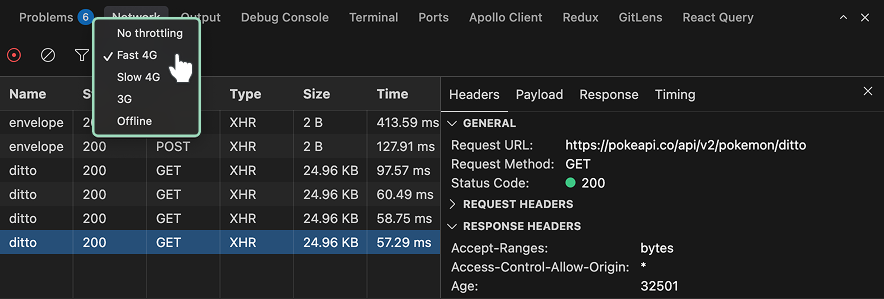
Network Throttling (iOS Simulator only)
When connected to an iOS Simulator, the Network Inspector allows you to throttle or turn off the network connection on the device. You can choose one of the presets in the drop-down and see how your application behaves in a network constrained environment or when disconnected from the Internet entirely.
Network Events Coverage
Current caveats and limitations:
iOS
The network inspector on iOS intercepts all network calls by overriding the behaviour of NSUrlSession class, used by React Native and most iOS libraries for network calls. This means you should be able to see all of the HTTP requests made by your application, with WebSocket support planned in the future.
Android
The network inspector on Android intercepts network traffic by hooking into OkHttp, the HTTP client used by React Native and most Android libraries. This means you should be able to see:
- HTTP requests made via
fetchandXMLHttpRequest Imagecomponent requests- Requests from most third-party libraries
Currently unsupported are:
- WebSocket connections
- Network requests from libraries that bypass OkHttp entirely