Debugging and logging
Breakpoints can be a powerful debugging tool. Thanks to Radon IDE, breakpoints work in VSCode without any additional setup for React Native and Expo projects.
Setting a breakpoint
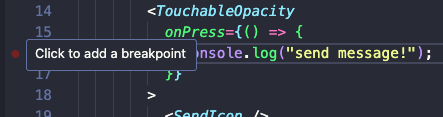
You can set a breakpoint on any JavaScript or TypeScript line of code. To set a breakpoint, click Click to add a breakpoint on the left margin of the line of code in your editor. The breakpoint will appear as a red dot next to this line.
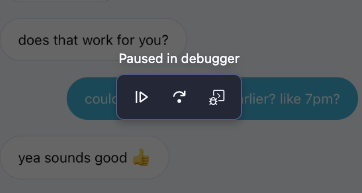
The Radon IDE will automatically pause the application execution whenever it encounters a breakpoint.
Debugger options
When code execution is paused, the debugger overlay includes several options for further debugging:
- Resume execution - resume code execution till the function ends, crashes or the debugger encounters another breakpoint,
- Step over - execute the current line of code and pause on the next line,
- Open debugger console - open the built-in VSCode log console.
Opening logs
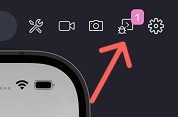
Radon IDE keeps track of the application logs. You can access the device logs by clicking the Logs button in the top-right corner of the panel.
Jumping from log to code
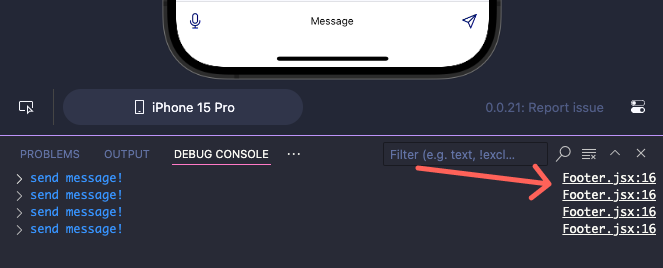
In the logs panel, you can click the underlined component name on the right side of the panel to quickly jump to the exact line of code where the console log was called.
Expanding logs
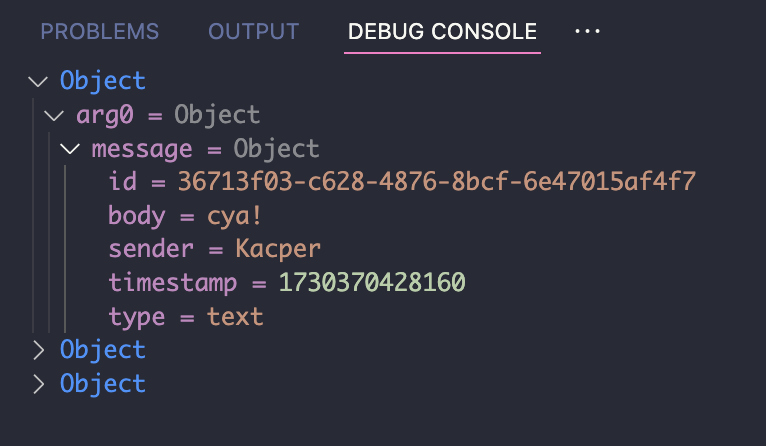
Radon IDE logs objects in a contracted form. You can expand the object log by clicking on it to see more details.
Clearing logs console
You can clear the console by right-clicking inside the logs panel and choosing the Clear Console option or using the ⌘ K shortcut.

Native logs
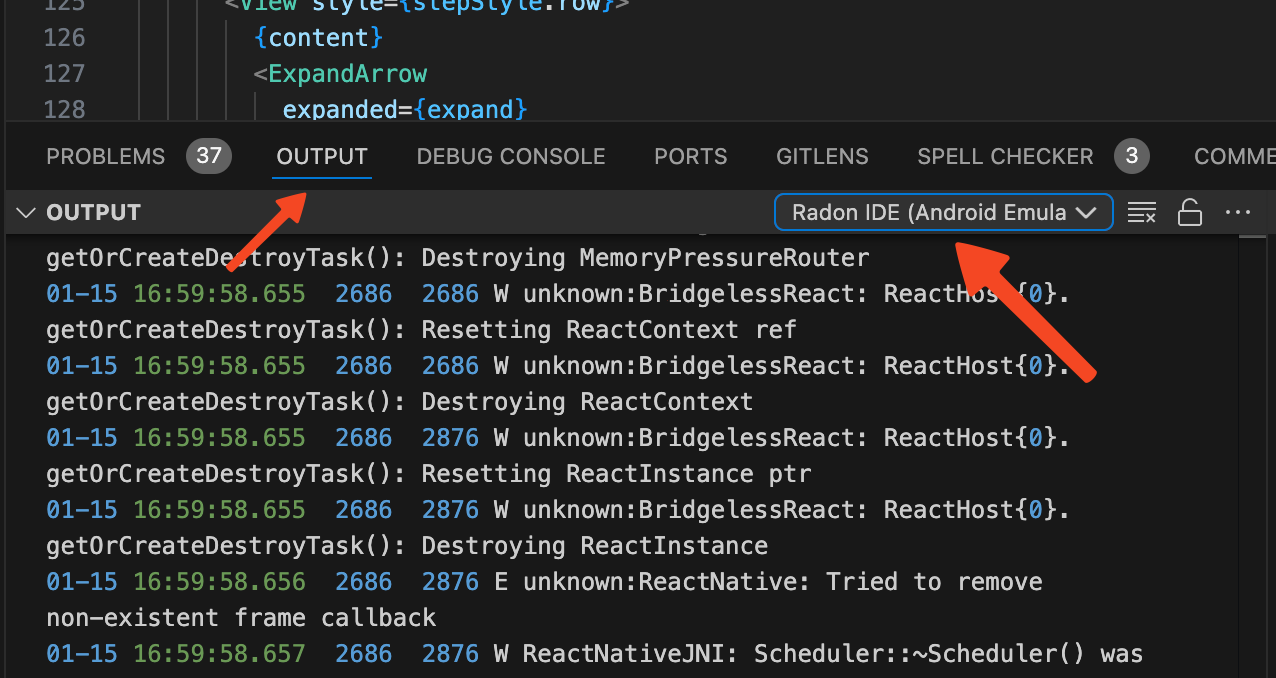
Radon IDE keeps track of your app's native logs. You can access them by going to OUTPUT > Radon IDE (Android Emulator Logs) or OUTPUT > Radon IDE (iOS Simulator Logs).
Build logs
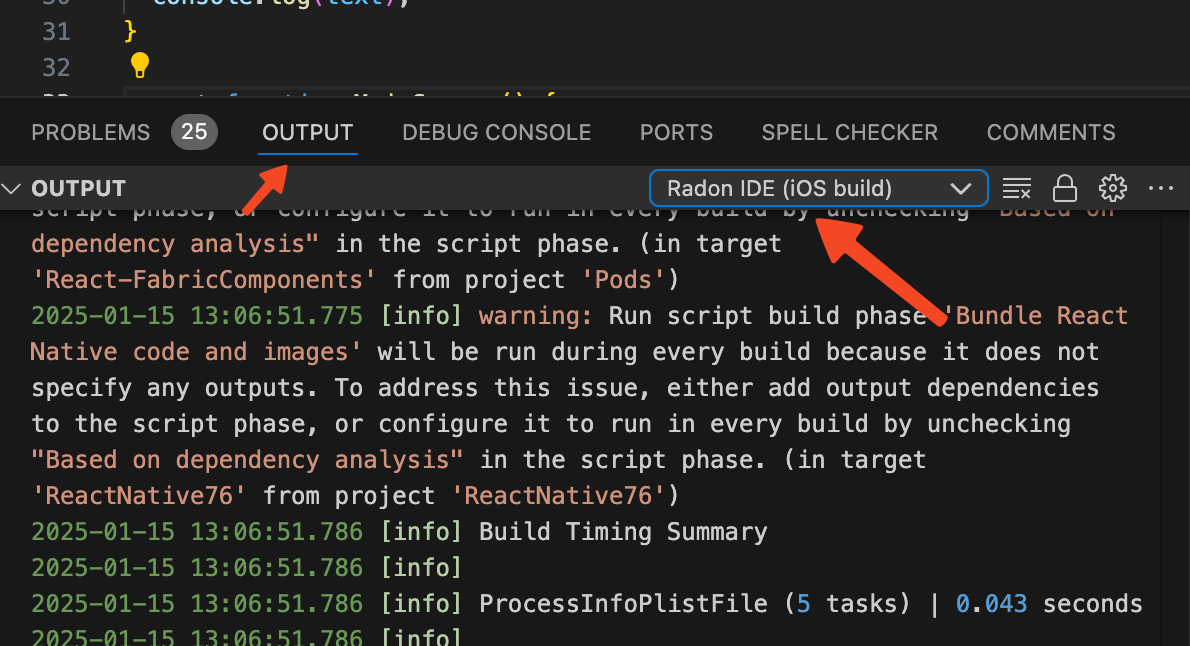
Radon IDE keeps track of your app's build logs. You can access them by going to OUTPUT > Radon IDE (iOS build) or OUTPUT > Radon IDE (Android build).
Handling runtime errors
Whenever a runtime error occurs in JavaScript code, a dialog appears above the device offering two actions:
- Copy error - copies the full error message and stack trace to your clipboard.
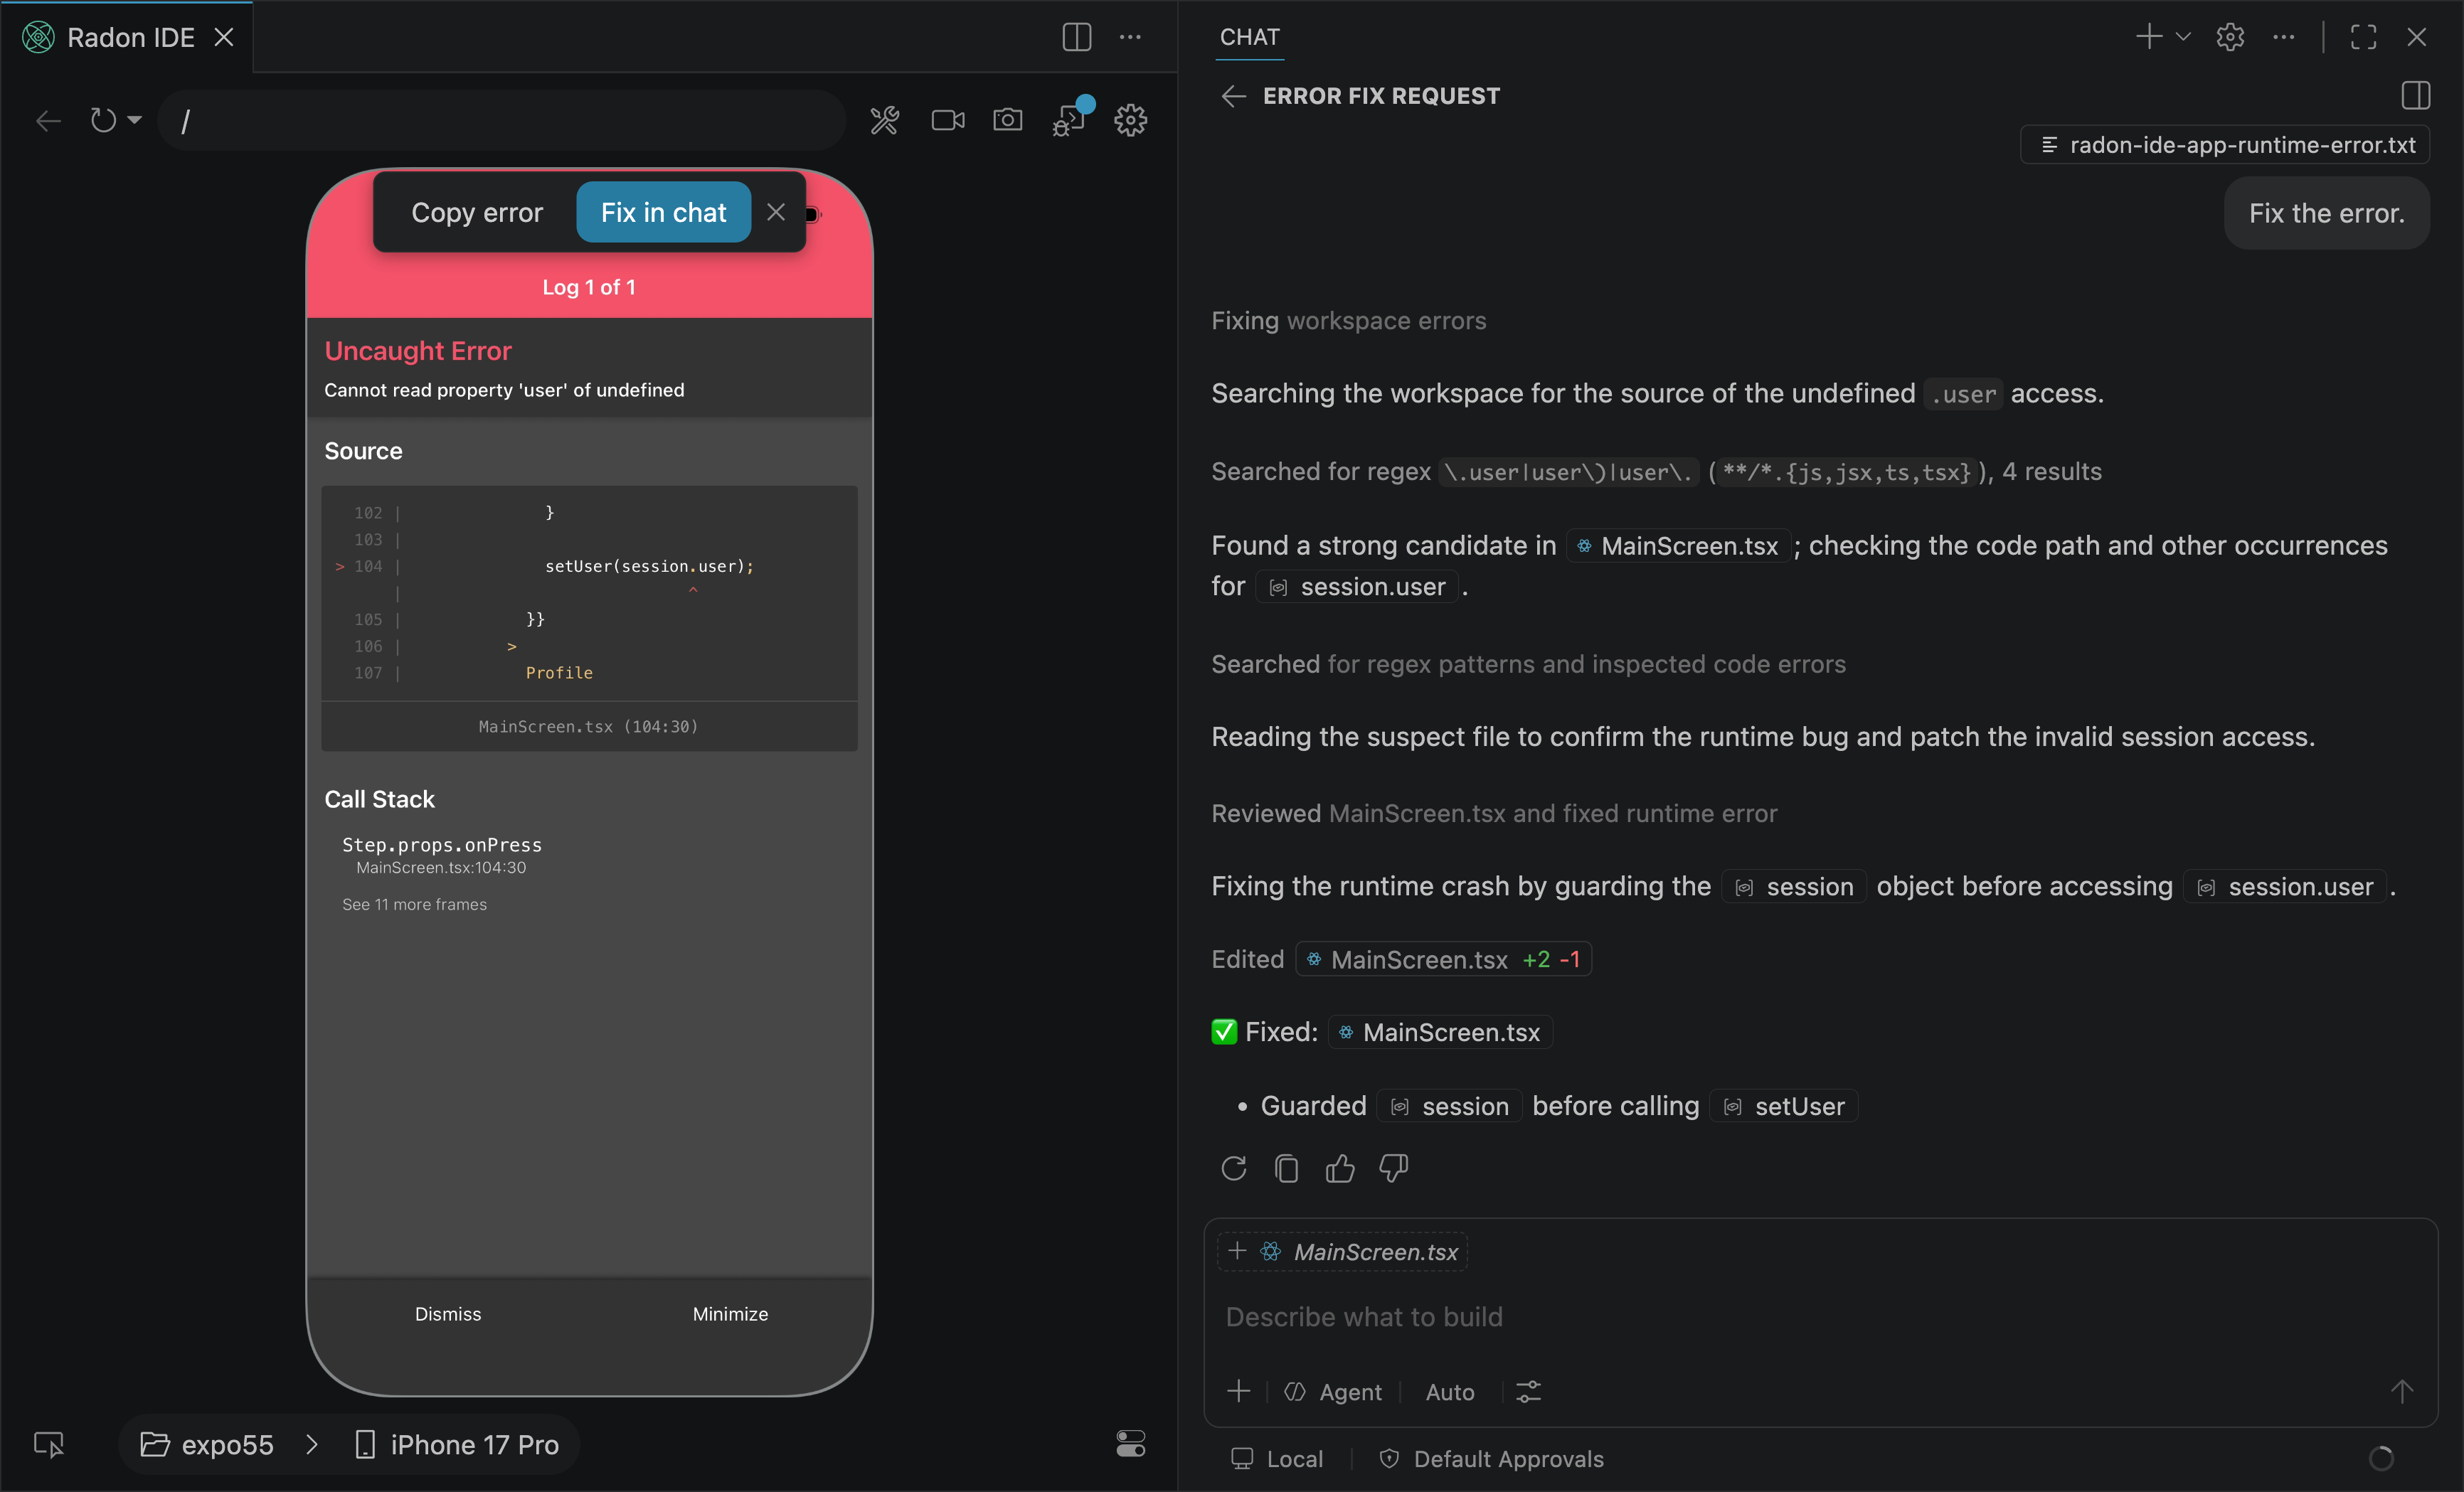
- Fix in chat - sends the error message and stack trace as a context to VS Code Copilot Chat or Cursor Composer so you can ask an AI agent for help right away.